
The user interface: overview
The QA Distiller main window is divided into the following areas:
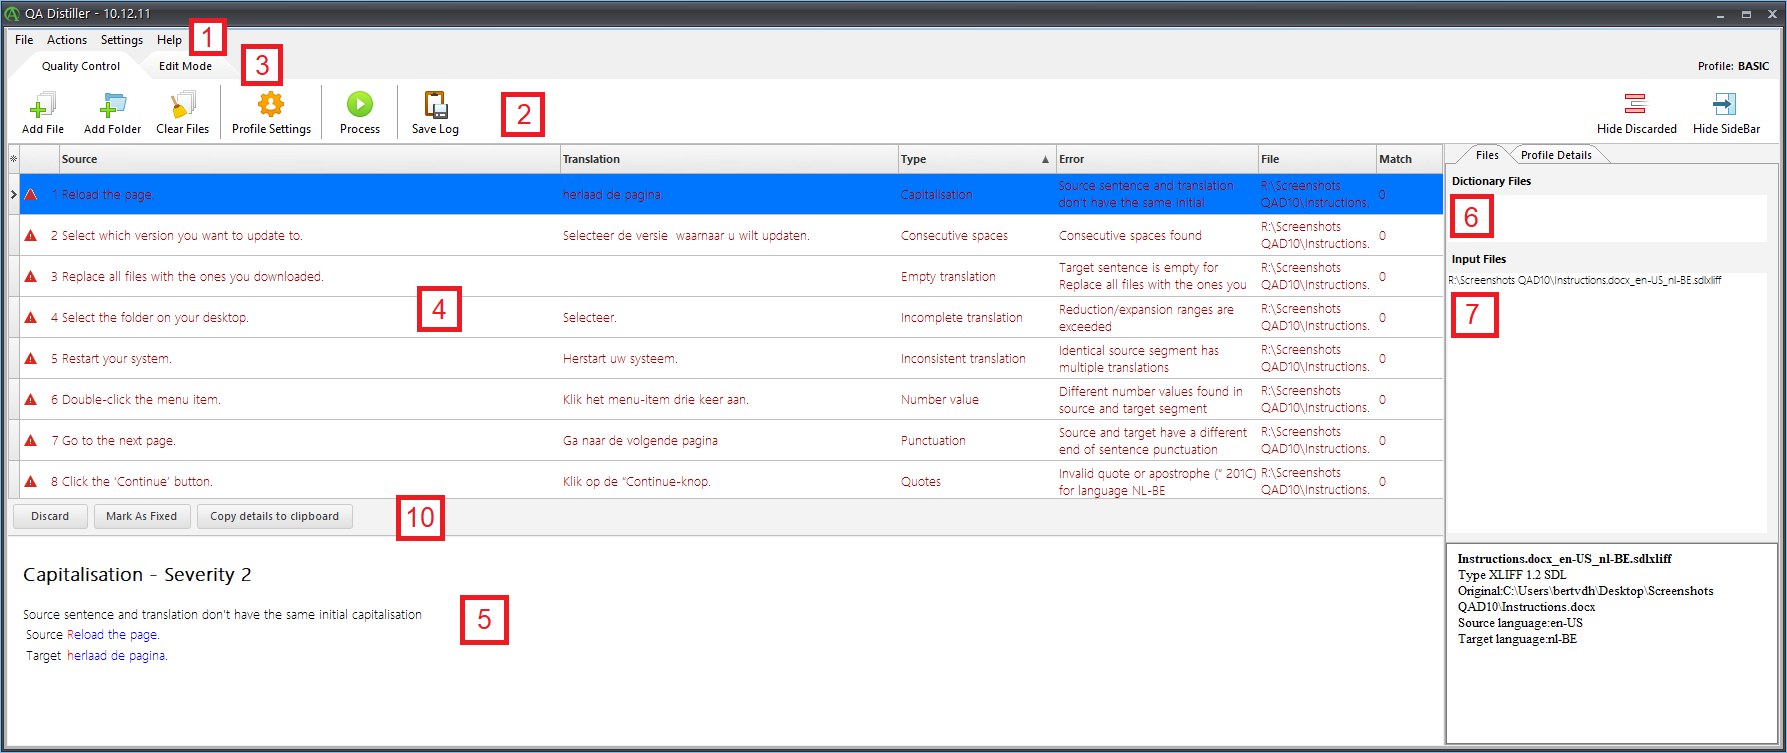
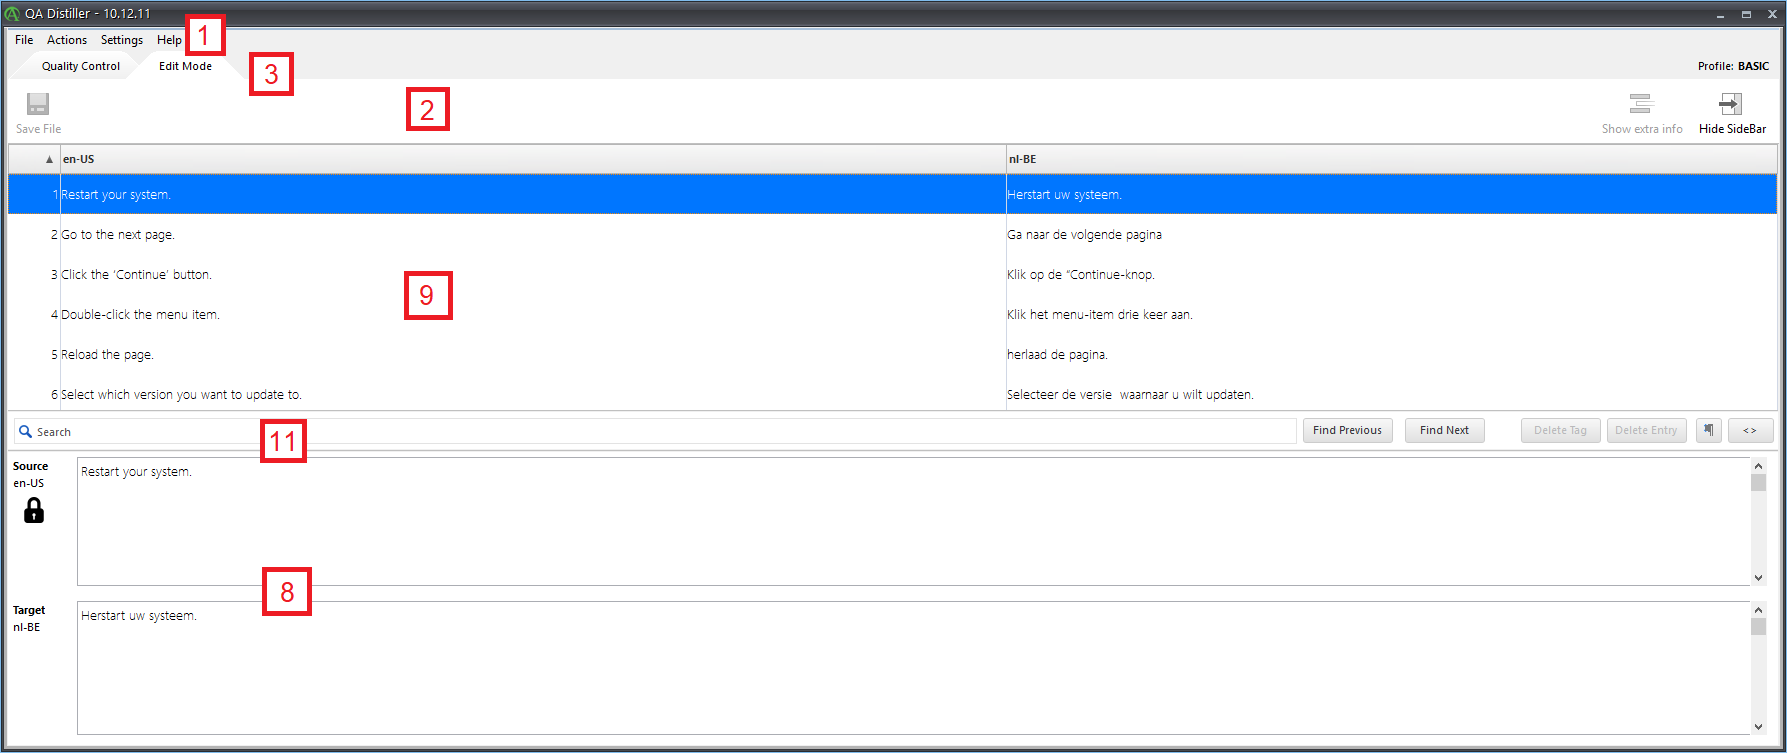
| No. | Name | Description |
|---|---|---|
| 1 | Menu bar | Where you can select commands. |
| 2 | Toolbar | Where you can trigger actions by clicking the icons. |
| 3 | Mode tabs | Where you can switch between viewing modes. Contains two tabs, one for Quality Control and one for Edit Mode. |
| 4 | Error pane | Shows the segments, listing the source and target text, error type, error explanation, file location and match rate. |
| 5 | Error detail pane | Displays the error of the selected segment in detail. If applicable, a quick correction suggestion is displayed as well. |
| 6 | Dictionary files pane | Displays the dictionary files that you have added. |
| 7 | Input files pane | Displays the input files that you have added. |
| 8 | Source/Target editor | Displays the source and target text of the selected segment. It also allows you to edit the source and target. |
| 9 | Source/Target pane | Display the translated segment of the selected file. |
| 10 | Call-to-action buttons bar (Quality Control) | Where you can trigger actions in Quality Control by clicking the buttons. |
| 11 | Call-to-action buttons bar & search bar (Edit Mode) | Where you can trigger actions in Edit Mode by clicking the buttons and perform searches using the search bar. |